TLDR
- Chainlink is trading within a multi-year symmetrical triangle pattern
- Recent price at $22.29 with slight 24-hour decline of 0.23%
- Technical analysis suggests a possible retest of $16 support level
- $25-$27 range identified as first hurdle for upward movement
- Long-term projection points to a potential $100 target after breakout
Chainlink’s price action has captured the attention of crypto market participants as it trades within a narrowing range that has kept traders on edge. With years of consolidation, the market is watching closely for signs of a decisive move in either direction.
The token is currently priced at $22.29, showing a minor 24-hour decline of 0.23%. Chainlink now holds the 13th position in global market rankings with a market capitalization of approximately $15.1 billion.
A recent analysis highlighted a multi-year symmetrical triangle pattern that has contained Chainlink’s price movements. This technical formation points to a potential dip toward the $16 level, which represents the ascending support line of the triangle.
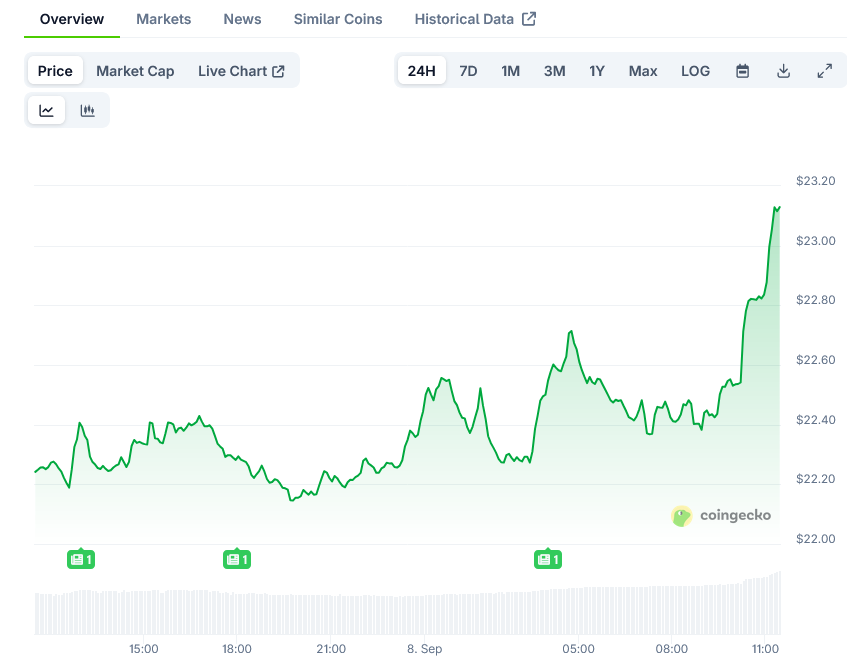 Chainlink Price on CoinGecko
This $16 zone has become a focal point for whale accumulation, suggesting that large holders view it as a strategic entry point. The pattern indicates this could be the final support test before a major trend shift.
From a technical perspective, the $25-$27 range represents the first major resistance area. A strong breakout above this zone would clear the path toward the macro pivot at $31, a level that has historically capped rallies.
Key Technical Levels
If momentum carries the token through the $31 resistance, the next target would be its previous all-time high in the $50-$52 range. The symmetrical triangle formation suggests an even more ambitious target of $100 once the breakout fully develops.
This projection is based on measuring the height of the triangle pattern, which gives an indication of the potential magnitude of the move after such a lengthy consolidation period.
Daily trading volume stands at approximately $1.23 billion, with an available supply of 678,099,970 LINK tokens in circulation. These metrics demonstrate the token’s established market presence and consistent trading activity across major exchanges.
TradingView charts show that Chainlink was recently priced at $22.05, reflecting a 1.03% daily decline. This follows an early August rally that pushed prices as high as $27.87 before sellers regained control.
Technical Indicators
The MACD technical indicator is currently positioned below the signal line, with histogram bars turning more negative. This alignment typically signals growing downward momentum and suggests continued selling pressure in the short term.
The Relative Strength Index (RSI) sits at 46.75, below the neutral 50 level. This reading confirms that bearish forces currently outweigh bullish activity, though the asset is not yet in oversold territory.
Market watchers consider the $19.53 level as critical support. A breakdown below this point could lead to deeper losses, while a rebound might provide the foundation for a potential trend reversal.
The token has been trading in a narrow range recently, reaching an intraday peak near $22.45 before entering a downward trend. Toward the end of the most recent 24-hour period, a minor recovery was recorded, suggesting buyers are defending current price levels.
Traders are watching these key levels closely, with many seeing the current consolidation as the calm before a potentially explosive move. The years-long triangle pattern appears to be approaching its apex, suggesting a resolution may come soon.


 English (US) ·