TLDR
- 553,000 OKB tokens ($58 million) entered exchanges in 24 hours, creating a heavy sell wall
- OKB surged 160% in 24 hours, briefly reaching a new all-time high above $135
- $1.1 million in long positions sit near key support zones, raising liquidation risk
- Top 100 OKB addresses increased holdings by 25% (59.98 million tokens)
- Weekly Chaikin Money Flow shows weakening buying pressure despite record prices
OKB, the native token of cryptocurrency exchange OKX, has experienced a meteoric rise of 160% in just 24 hours, briefly touching a new all-time high above $135. The rally has been fueled by several bullish factors, including quarterly token burns, shrinking circulating supply, and speculation about a potential OKX IPO.
However, on-chain data reveals potential warning signs that could challenge the sustainability of this rapid price increase. Most notably, a substantial amount of OKB tokens has moved to exchanges, creating selling pressure that could reverse recent gains.
Data from analytics platform Nansen shows 553,000 OKB tokens (worth approximately $58 million at $106.19) have entered exchanges within the past 24 hours. This represents a 36.03% increase in exchange balances, suggesting many holders may be preparing to sell their tokens following the price surge.
Despite this influx of tokens to exchanges, there’s a countervailing force in the market. The top 100 OKB addresses have actually increased their holdings by 25%, adding approximately 59.98 million tokens to their wallets.
This whale accumulation far exceeds the amount of tokens that entered exchanges in the same period, potentially indicating that large investors remain bullish on OKB’s prospects. Their buying power could help absorb selling pressure before it triggers a deeper market correction.
Liquidation Risks Loom
The current market structure reveals potential downside risks for OKB’s price. According to BingX’s liquidation heatmap, there are $1.1 million in long positions clustered near the $92.6 mark, with another smaller concentration just above $100.
These liquidation clusters could act as tripwires in a market downturn. If selling pressure pushes prices below these levels, it might trigger a cascade of forced liquidations, further accelerating price declines.
The relatively small gap between current prices and these liquidation zones increases the probability of a sharp downturn if market momentum shifts to the downside.
Technical Indicators Show Weakening Momentum
Analysis of OKB’s weekly price chart provides additional context for understanding the token’s recent performance. Currently, OKB is holding the $102 support level after failing to break through resistance at $142.
Maintaining this support is crucial, as a breakdown would likely trigger the liquidation of long positions clustered between $102 and $106. Should this support fail, the next major support zones exist at $90 and $78, respectively.
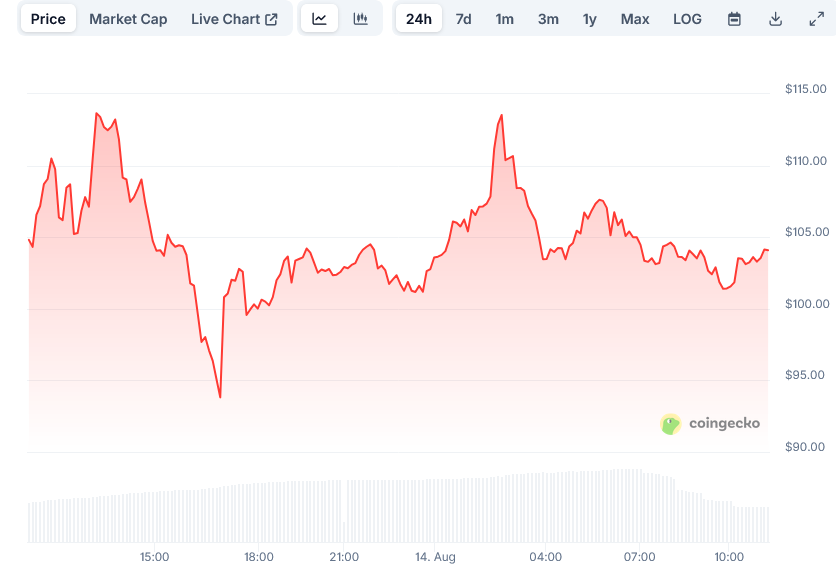 OKB Price on CoinGecko
The Chaikin Money Flow (CMF) indicator, which measures buying and selling pressure, reveals a concerning divergence. Despite OKB reaching record price levels, the CMF shows a lower high compared to November 2024 levels.
This technical divergence suggests that less capital is flowing into OKB during the current rally compared to previous price peaks. Such divergences often indicate weakening buying pressure and can precede price corrections.
For OKB to maintain its bullish momentum, the price would need to reclaim the $118 resistance level. Additionally, exchange inflows would need to decrease while large holders continue their accumulation pattern.
If these conditions are met, OKB could potentially retest the $142 level. However, the current on-chain data and technical indicators suggest caution may be warranted despite the impressive price performance.
The OKB price movement continues to unfold as market participants react to this mix of bullish accumulation patterns and concerning exchange inflows. The $102 support level remains the key level to watch in the coming days.


 English (US) ·