 7 months ago
37
7 months ago
37

Software engineer Sven Scharmentke (AKA Svnscha) has shared a project that they say "might change crash dump analysis forever." The new contextual natural language conversational tool contrasts sharply with manually typing arcane commands into a terminal to analyze crash data, which is the established modus operandi of a professional software engineer, even in 2025. Svnscha goes on to assert that the new open-source tool, available as mcp-windbg on GitHub, can go deep. The AI runs a "simply amazing" array of WinDBG/CDB commands, boosting productivity and eradicating a once tedious task.
AI peddlers have developed large language models that initially targeted creative writing and have since moved to visual arts – graduating from hand-drawn style art and photorealistic creations to videos in recent times. AI has also made significant inroads into computer programming. However, most people want AI to leave the fun, creative stuff to humans and take the sting out of dull, soul-crushing, repetitive tasks. This seems to be where Svnscha's mcp-windbg might actually succeed.
In brief, the mcp-windbg tool enables AIs to interact with Microsoft's multipurpose debugger WinDBG. Its cunning skill is in giving LLMs the ability to execute debugger commands. And, even if you have swallowed the WinDBG manual, this AI will know debugger commands better than you. Copilot will probably also interpret assembly code, decode hexadecimal, traverse structures with symbols, and other tasks much better than you. You just have to ask the right questions.
Background and demos
Svnscha goes into some detail about their prior frustration in debugging crashes, the lightbulb moment to involve AI, and how the mcp-windbg tool works, all in a dedicated blog post. The software engineer humbly admits the 'hard part" of this work was implementing the CDB (Microsoft's Command-Line Console Debugger) interaction layer, and this was done during a session "vibe-coding with two coffees on a Saturday morning."
However, the videos shared help encapsulate the leveraging of Copilot with CDB. There are two to watch on the linked blog, starting with a Crash Analysis and Automated Bugfix using Copilot, followed by an Automated Crash Dump Analysis of Multiple Crash Dump Files.
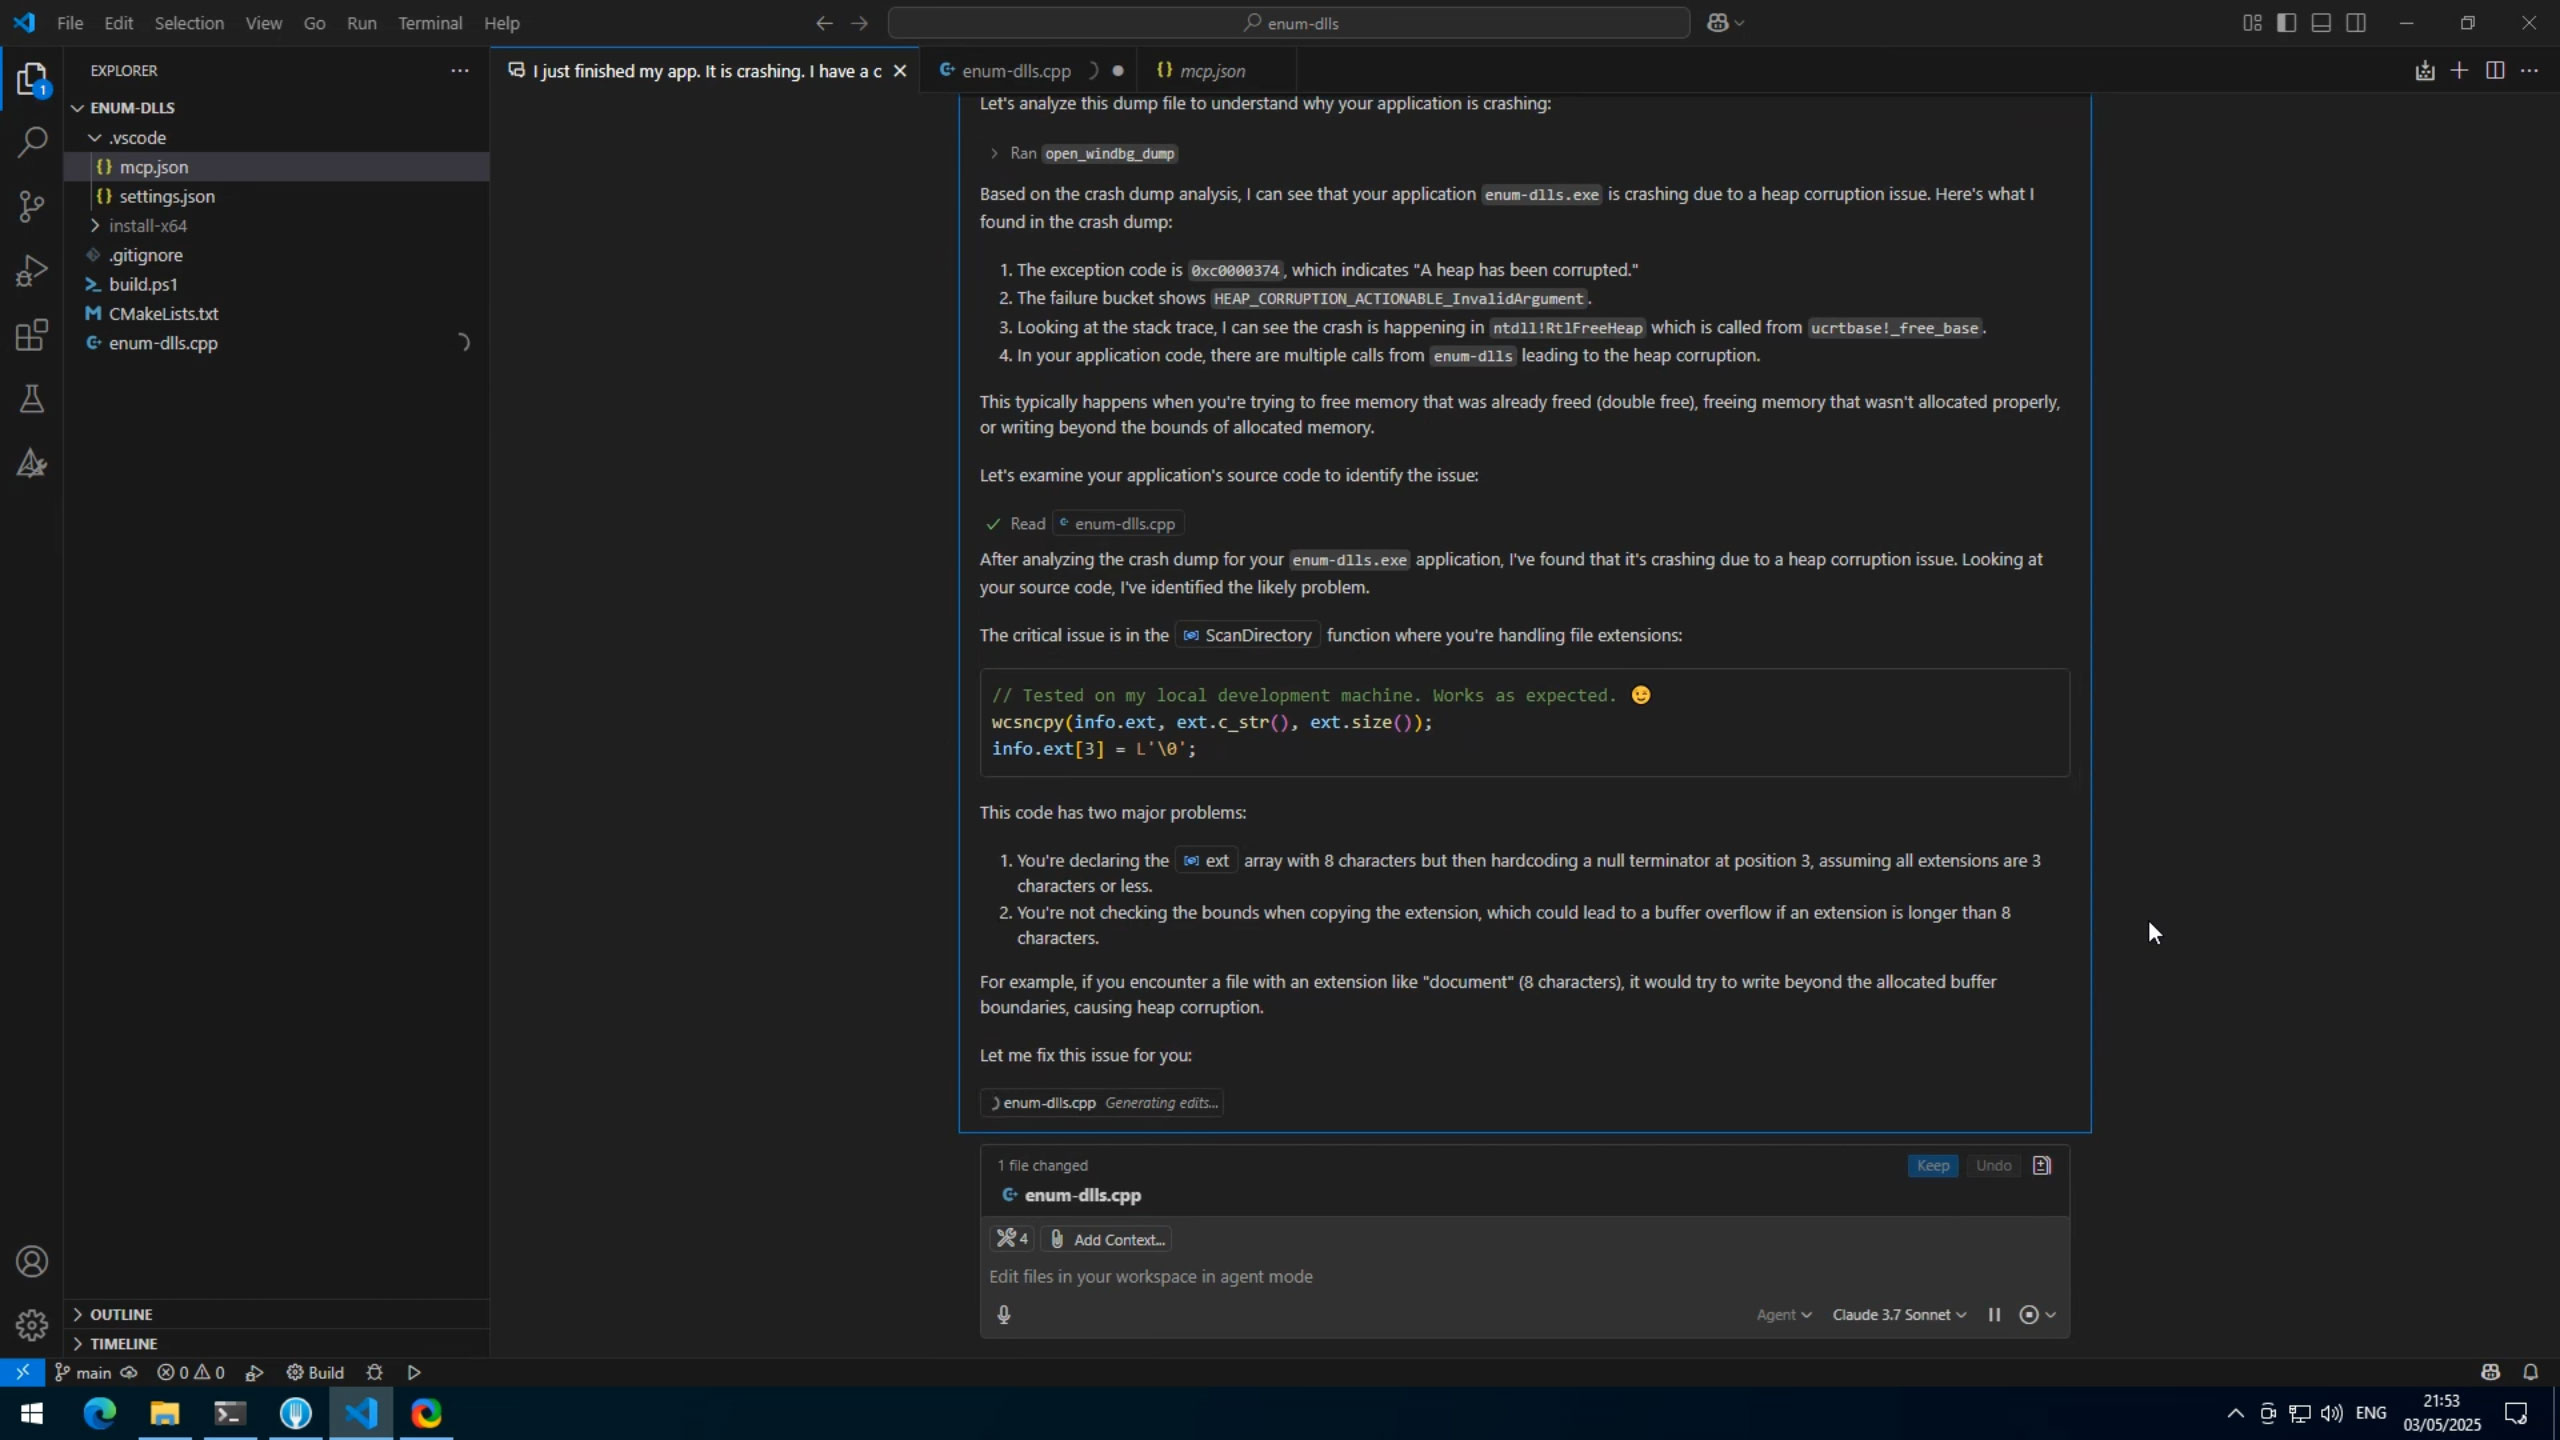
What you first see shows Svnscha installing mcp-windbg, then running a Windows app that crashes. Next, GitHub Copilot is fired up and asked to find the crash dump and fix the underlying code issue. "The AI quickly identifies that the application crashed, explains which specific conditions led to the crash, and suggests a fix," says Svnscha.
The second video is similar but shows the tool analyzing multiple files simultaneously.
'Simple wrapper' lifts crash analysis from the stone age to the rocket age
What this all means, in practical terms, is that mcp-windbg can enable natural language crash analysis, contextual debugging, and root cause identification. Svnscha believes this can be a game-changer for other software engineers, support, quality assurance, and anyone else who comes into contact with crash dumps.
"It's like going from hunting with a stone spear to using a guided missile," Svnscha not-too-humbly boasts. However, they remind those eyeing this new tool, that it isn't a magical coding cure-all and that a modicum of debugging knowledge is still required to make the most of what is basically a "simple Python wrapper around CDB that relies on the LLM's WinDBG expertise."
Follow Tom's Hardware on Google News to get our up-to-date news, analysis, and reviews in your feeds. Make sure to click the Follow button.


 English (US) ·