TLDR
- XRP price is in a downtrend, currently trading around $2.78, down 1.78% in 24 hours
- Declining onchain activity with active addresses dropping from 50,000 to 19,250
- Technical patterns show a descending triangle formation with critical support at $2.70
- Futures open interest has decreased from $10.94 billion to $7.7 billion
- A breakdown below $2.70 could trigger a 25% drop to around $2.08
XRP, the native cryptocurrency of the Ripple network, continues to face selling pressure as it extends losses from last week’s sharp sell-off. The digital asset is currently trading at $2.78, representing a 1.78% decrease over the past 24 hours.
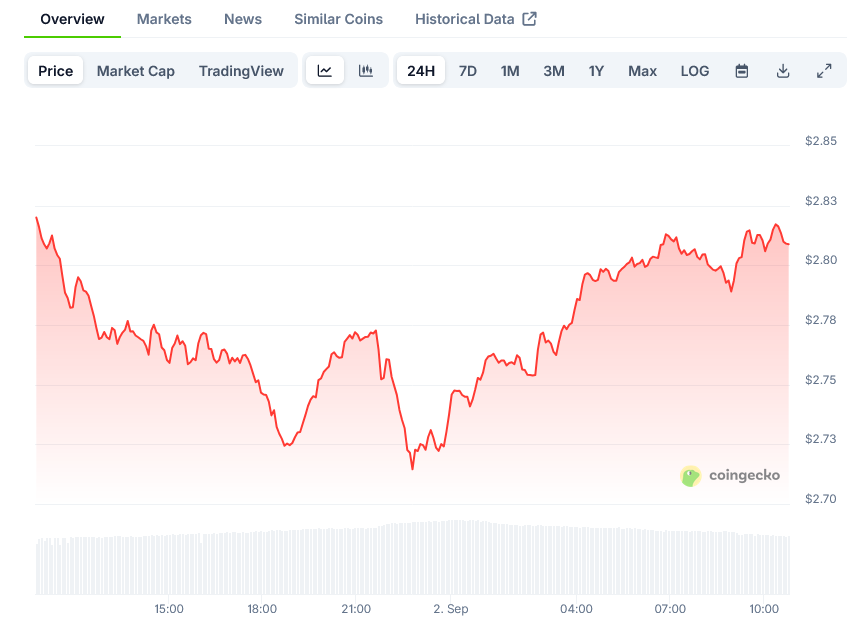 XRP Price on CoinGecko
Market sentiment has shifted toward caution in the broader cryptocurrency ecosystem. The Crypto Fear & Greed Index has slipped into the “fear” zone at 46, down from “neutral” levels observed last week and “greed” territory from a month ago, according to data from Alternative.me.
This cautious approach is clearly reflected in the onchain metrics for XRP. The number of active addresses interacting with the XRP Ledger has seen a steep decline over recent weeks, falling to approximately 19,250 on Monday from around 50,000 in mid-July.
The Active Addresses metric tracks wallets that are sending or receiving XRP. Such a dramatic reduction indicates waning interest and engagement from users, potentially leaving the asset vulnerable to increased selling pressure.
Further evidence of declining investor interest can be seen in the futures market. The open interest (OI) for XRP futures has contracted significantly to $7.7 billion from $10.94 billion over the same period.
This reduction in open interest suggests diminishing conviction among traders, which could increase the likelihood of the current downtrend persisting in the short term.
Critical Support Level
From a technical perspective, XRP price has been forming a descending triangle pattern on its daily chart since reaching a multi-year high of $3.66 in July. This pattern is characterized by a flat support level and a downward-sloping resistance line.
Traders typically view a descending triangle that forms after a strong uptrend as a bearish reversal indicator. According to technical analysis principles, this setup typically resolves when the price breaks below the flat support level, potentially triggering a decline equal to the triangle’s maximum height.
The bulls are currently fighting to maintain XRP above the triangle’s support line at $2.70. If they succeed, the price could potentially rise to challenge the upper trendline at $3.09, which coincides with the 50-day simple moving average (SMA) and the 0.618 Fibonacci retracement level.
A breakthrough above this resistance would confirm bullish momentum and potentially trigger a rally toward the apex of the pattern around $3.70.
However, if the $2.70 support fails to hold, another sell-off could be triggered. The next support zone lies between $2.60 (the 100-day SMA) and $2.48 (the 200-day SMA).
A breakdown below these levels could see XRP price fall toward a downside target of approximately $2.08 over the coming weeks, representing a 25% drop from current price levels.
Recovery Attempts
Despite the bearish outlook, XRP has shown some signs of attempting to recover. After testing the critical $2.70 support level and reaching a low of $2.7018, the price has started to correct some of its recent losses.
The price moved above the 23.6% Fibonacci retracement level of the downward move from the $3.040 swing high to the $2.701 low, indicating some buying interest at lower levels.
On the hourly chart, there is a bearish trend line forming with resistance at $2.820. If buyers can protect the $2.750 support, the price might attempt another increase toward the $2.850 resistance level.
A clear move above $2.850 could potentially send the price toward $2.880, with further resistance at $2.920, near the 61.8% Fibonacci retracement level of the recent downward move.
The liquidation heatmap shows XRP buyers stepping in at the $2.70 level, with large clusters of ask orders sitting between $2.87 and $3.74, which could present resistance on any upward move.
XRP is currently trading below both the $2.820 level and the 100-hourly Simple Moving Average, suggesting that bears still maintain control of the short-term trend.
The hourly technical indicators show mixed signals, with the MACD losing pace in the bearish zone while the RSI has moved above the 50 level, indicating some positive momentum building.
The price of XRP reached a multi-year high of $3.66 in July before beginning its current downtrend, which has now extended for several weeks.


 English (US) ·